

Oil supply shock plus rising fuel prices

Peek of the Week
Weekly Market Commentary
September 14, 2026
The Markets
The influence of supply and demand.
Last week offered a lesson in supply and demand, along with a reminder that financial markets are always looking to the future. As disruptions in the Middle East squeezed oil supplies, rising fuel prices and August inflation data seemed to set the stage for higher interest rates and lower stock prices. Then, Friday’s news that demand for oil may be weakening changed the outlook, and stock markets found a bit of relief.
Here are some highlights from last week:
There was an oil supply shock. Conflict in the Middle East expanded, further reducing the availability of oil. “For Middle Eastern oil producers, there are fewer and fewer places to hide from Iranian violence. And because of that, oil prices are almost certain to stay high,” reported Avi Salzman of Barron’s.
Falling supply pushed fuel prices higher, pressuring inflation. Diesel fuel reached an all-time high of $6.00 a gallon, up from $3.70 a year ago. Diesel is required for “around 70 percent of the movements of freight, rail, agriculture, and construction equipment, and is a key component of domestic inflation when prices rise,” reported Callum Keown and Martin Baccardax of Barron’s.
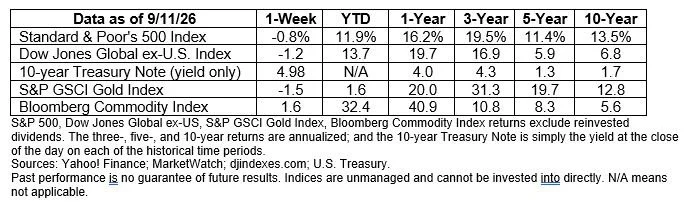
Higher inflation changed the interest rate outlook. Consumer and Producer Price readings for August arrived last week, showing inflation remained high. As investors considered the possible impact of higher oil prices, the chance of a Fed rate hike in September climbed above 85 percent, according to CME FedWatch. In response, the 10-year Treasury yield approached 5 percent.
The forecast for oil demand changed. On Friday, the International Energy Agency (IEA) Oil Market Report forecast that global demand for oil will fall more sharply than expected in the latter half of 2026 because of higher prices and economic disruptions.
Markets welcomed the possibility that weaker demand for oil could eventually ease oil prices and inflation pressures. After four days of declines, stock markets rallied on Friday.
The supply problem, however, has not gone away. The IEA expects oil supply to fall even faster than demand, while global inventories are being rapidly depleted. In other words, Friday’s rally did not indicate the oil shock is over. It reflected a change in the outlook, and a reminder that markets care about where prices are today, and where they may be headed tomorrow.
Last week, major U.S. stock indexes finished the week lower, despit
HERE’S HOW A BOND WORKS. A bond is a loan. When investors buy U.S. Treasury bonds, they agree to lend their money to the government for a specific period of time. In return, the government agrees to pay interest for that period and return the amount borrowed when the bond matures. In the interim, Treasury bond rates may move higher or lower. The market value of the Treasury, which is the value an investor receives if they sell the bond before maturity, will change to reflect current rates.
How do rates affect bond prices?
There is a question about this on FINRA’s financial literacy quiz that stumps a lot of people every year. It asks: If interest rates rise, what will typically happen to bond prices?
They rise.
They fall.
They stay the same.
Nothing. There is no relationship between interest rates and bond prices.
The correct answer is that bond prices fall when rates rise.
There is an inverse relationship between bond prices and interest rates
Imagine that a fictional investor, Chris, buys a 10-year U.S. Treasury for $1,000. It pays 4 percent interest. After a few months, interest rates rise. Newly issued 10-year Treasuries offer 5 percent interest. Chris can hold the bond to maturity (and continue to receive 4 percent interest) or sell it. If Chris sells, the bond will be worth less than the amount originally paid because new bonds have higher rates.

It works the other way, too. Imagine that after Chris buys the bond, interest rates fall, 10-year U.S. Treasuries now pay 3 percent interest. Chris can hold the bond (and receive 4 percent interest until maturity) or can sell the bond. It will be worth more than Chris paid because new bonds have lower rates.

It may help to think of bonds as a seesaw. At one end are bond prices, at the other are interest rates. As one falls, the other rises. If you have questions about bonds, please get in touch.
WEEKLY FOCUS – THINK ABOUT IT
"Where there is great love, there are always miracles."
—Willa Cather, Author
Best regards,
Leif M. Hagen, CLU, ChFC
LPL Financial Advisor
Achievement Financial
Dream. Plan. Achieve.
P.S. Please feel free to forward this commentary to family, friends or colleagues. If you would like us to add them to the list, please reply to this email with their email address and we will ask for their permission to be added.
Securities offered through LPL Financial, Member FINRA/SIPC.

* These views are those of Carson Coaching, not the presenting Representative, the Representative’s Broker/Dealer, or Registered Investment Advisor, and should not be construed as investment advice.
* This newsletter was prepared by Carson Coaching. Carson Coaching is not affiliated with the named firm or broker/dealer.
* Government bonds and Treasury Bills are guaranteed by the U.S. government as to the timely payment of principal and interest and, if held to maturity, offer a fixed rate of return and fixed principal value. However, the value of fund shares is not guaranteed and will fluctuate.
* Corporate bonds are considered higher risk than government bonds but normally offer a higher yield and are subject to market, interest rate and credit risk as well as additional risks based on the quality of issuer coupon rate, price, yield, maturity, and redemption features.
* The Standard & Poor's 500 (S&P 500) is an unmanaged group of securities considered to be representative of the stock market in general. You cannot invest directly in this index.
* All indexes referenced are unmanaged. The volatility of indexes could be materially different from that of a client’s portfolio. Unmanaged index returns do not reflect fees, expenses, or sales charges. Index performance is not indicative of the performance of any investment. You cannot invest directly in an index.
* The Dow Jones Global ex-U.S. Index covers approximately 95% of the market capitalization of the 45 developed and emerging countries included in the Index.
* The 10-year Treasury Note represents debt owed by the United States Treasury to the public. Since the U.S. Government is seen as a risk-free borrower, investors use the 10-year Treasury Note as a benchmark for the long-term bond market.
* Gold represents the 3:00 p.m. (London time) gold price as reported by the London Bullion Market Association and is expressed in U.S. Dollars per fine troy ounce. The source for gold data is Federal Reserve Bank of St. Louis (FRED), https://fred.stlouisfed.org/series/GOLDPMGBD228NLBM.
* The Bloomberg Commodity Index is designed to be a highly liquid and diversified benchmark for the commodity futures market. The Index is composed of futures contracts on 19 physical commodities and was launched on July 14, 1998.
* The DJ Equity All REIT Total Return Index measures the total return performance of the equity subcategory of the Real Estate Investment Trust (REIT) industry as calculated by Dow Jones.
* The Dow Jones Industrial Average (DJIA), commonly known as “The Dow,” is an index representing 30 stock of companies maintained and reviewed by the editors of The Wall Street Journal.
* The NASDAQ Composite is an unmanaged index of securities traded on the NASDAQ system.
* International investing involves special risks such as currency fluctuation and political instability and may not be suitable for all investors. These risks are often heightened for investments in emerging markets.
* Yahoo! Finance is the source for any reference to the performance of an index between two specific periods.
* The risk of loss in trading commodities and futures can be substantial. You should therefore carefully consider whether such trading is suitable for you in light of your financial condition. The high degree of leverage is often obtainable in commodity trading and can work against you as well as for you. The use of leverage can lead to large losses as well as gains.
* Opinions expressed are subject to change without notice and are not intended as investment advice or to predict future performance.
* Economic forecasts set forth may not develop as predicted and there can be no guarantee that strategies promoted will be successful.
* Past performance does not guarantee future results. Investing involves risk, including loss of principal.
* The foregoing information has been obtained from sources considered to be reliable, but we do not guarantee it is accurate or complete.
* There is no guarantee a diversified portfolio will enhance overall returns or outperform a non-diversified portfolio. Diversification does not protect against market risk.
* Asset allocation does not ensure a profit or protect against a loss.
* Consult your financial professional before making any investment decision.
* To unsubscribe from the “Peek of the Week” please reply to this email with “Unsubscribe” in the subject line or write us at Leif@AchievementFinancial.com
Sources:
https://www.barrons.com/articles/saudi-arabia-pipeline-attack-oil-prices-baad5543 or go to https://resources.carsongroup.com/hubfs/WMC-Source/2026/09-14-26-Barrons-The-Saudi-Arabia-Pipeline%20-%201.pdf
https://www.barrons.com/articles/diesel-prices-fed-rate-decision-c9076122 or go to https://resources.carsongroup.com/hubfs/WMC-Source/2026/09-14-26-Barrons-Record-Diesel-Prices%20-%202.pdf
https://www.bls.gov/news.release/pdf/ppi.pdf
https://www.bls.gov/news.release/PDF/cpi.PDF
https://www.cmegroup.com/markets/interest-rates/cme-fedwatch-tool.html or go to https://resources.carsongroup.com/hubfs/WMC-Source/2026/09-14-26-CME-Group-Fedwatch-Tool%20-%205.pdf
https://www.iea.org/reports/oil-market-report-september-2026
https://www.barrons.com/market-data?mod=BOL_TOPNAV or go to https://resources.carsongroup.com/hubfs/WMC-Source/2026/09-14-26-Barrons-DJIA-S&P-Nasdaq%20-%208.pdf
https://www.investopedia.com/articles/bonds/08/bond-market-basics.asp
https://www.finra.org/financial_knowledge_quiz
https://www.goodreads.com/author/quotes/881203.Willa_Cather
Photo by Ben Wicks on Unsplash